<%NUMBERING1%>.<%NUMBERING2%>.<%NUMBERING3%> PRTG Manual: Show Dependencies
This function shows an overview of the dependencies configured for the objects in your setup. For a general introduction please see Dependencies section.
In the main menu, choose Devices, and then hover the menu item Dependencies to show other menu items. Follow the menu path (it is specific to your setup) to view dependencies of the objects in a specific probe or group only.
- Selected Dependencies will show a table of manually set dependencies (section Select object in any object's settings).
- Master Dependencies will show a table of master dependencies.
- Dependencies Graph will show a visualization of dependencies. See below.

Dependencies Graph View
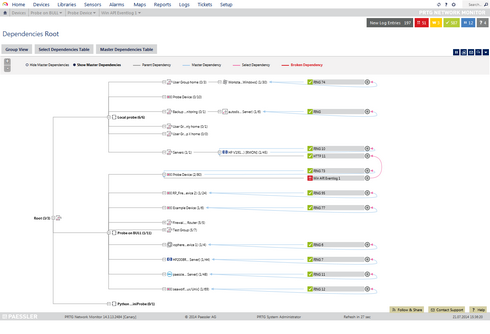
Choose the menu item Dependencies Graph to see the device tree in the dependencies graph view with lines of different color connecting objects. Hover Dependencies Graph to show other menu items for the dependency graph (probes and groups). Click a probe or group menu item to show its dependencies directly. The lines in the dependencies graph symbolize dependencies between the monitoring objects in the device tree. Additionally, a color code is used for the dependencies.
- Above the graph header bar, you can switch the dependencies view to tables of the currently selected object with the buttons Select Dependencies Table and Master Dependencies Table. The button Group View will show the Overview tab of the currently selected object.
- Mark the radio button in the header bar to Show Master Dependencies. By default, Hide Master Dependencies is selected and only parent, selected, and broken dependencies are shown.
- Click on the + or — buttons on the left in the header bar to zoom in resp. out of graph.
- Click on probe and group nodes to show the respective dependencies.
- Click on device or sensor nodes to open the respective overview tab.
- Click on the + resp. — boxes to expand resp. collapse probe and group nodes.
- Numbers in parentheses indicate how many child nodes of an object are shown.
- The Highlight Connection buttons right to sensors will show the corresponding dependency line and parent and dependent objects in bold.
Color Code of Dependencies Graph
The line's colors show the kind and source of a dependency. This represents the Dependency Type as defined in the Schedule, Dependencies, and Maintenance Window settings of a probe, group, device, or sensor. Note: You can find the color legend also in the graph header bar.
- Gray
Gray lines show a dependency by inheritance (Use parent). The source of the dependency is the parent object on the left end of the line, for example, Root is the parent of Local Probe. - Pink
Pink lines show a dependency that was set manually (Select object). The source of the dependency points to the dependent with a pink arrow at the line's end. - Blue
Blue lines show a master dependency for a device (Master object for parent). The sensor which is set as master points to the dependent device with a blue arrow head at the line's end; the arrow head from the dependent device to its master object is pink. - Red
The red color indicates broken dependencies, for example, if the master is not available.
Other Ajax Web Interface Sections |
|---|
Related Topics |
|---|
Keywords: Sensor,Sensor Dependencies